Data Science
Clustering in Machine Learning: Finding Hidden Groups in Your Data
A simple introduction to clustering. What it is, how it differs from classification, and real retail examples.
Picture a giant box of mismatched socks dumped on the floor. Nobody labeled them, nobody sorted them; but within seconds, your eyes start grouping them by color, size, and pattern. You didn't need instructions to do that. You just noticed the natural groupings.
That, in a nutshell, is what clustering does for data. It's one of the most widely used techniques in machine learning. If you worked in the areas related analytics, customer data, or anomaly detection, you must have probably already benefited from it without realizing it. Let's break it down properly; from the basics to real applications you can picture in a retail setting.
What Is Clustering?
Clustering is a predictive analytics technique in which data points are grouped into a finite number of clusters or groups where the members share similar characteristics or behavior. It's commonly used to:
- Identify customer segments
- Detect behavioral patterns
- Spot anomalies or outliers
In simple terms, clustering takes a messy, unlabeled pile of data and organizes it into distinct groups where the members "belong together" based on how similar they are.
A Simple, Real-World Example
Imagine a school playground with 10 kids during recess. Four of them are kicking a football around, and six are shooting hoops on the basketball court. Nobody assigned them to those groups ahead of time, they naturally gravitated toward kids doing the same activity.
If you only had data about where each kid was standing and what motion they were making (without being told "these are the football kids" and "these are the basketball kids"), a clustering algorithm could still figure out that there are two distinct groups, 4 in one, 6 in the other, purely from the patterns in the data.
Now let's translate that to a business setting: instead of kids and sports, imagine thousands of customers and their shopping habits. A retailer doesn't know in advance which customers are "bargain hunters" and which are "premium shoppers", but clustering can uncover that structure automatically.
What Kind of Technique Is Clustering?
Clustering is an unsupervised learning technique. That means we do not provide the algorithm with labeled examples ahead of time. Unlike supervised techniques, where the model learns from data that already has "correct answers" attached, clustering works the other way around:
- You feed in raw, unlabeled data.
- The algorithm looks for natural structure or similarity within that data.
- Only after the algorithm runs do you discover the inherent groups and it's up to us to interpret what each group represents (e.g., "these must be our high-value customers").
In other words, clustering algorithms attempt to solve a kind of classification problem in reverse: instead of predicting a known class for new data, the goal is to discover what classes even exist in the data in the first place.
Clustering vs. Classification: What is the Difference?
This is one of the most common points of confusion for people newer to machine learning, since both techniques deal with "grouping" data. But they solve fundamentally different problems.
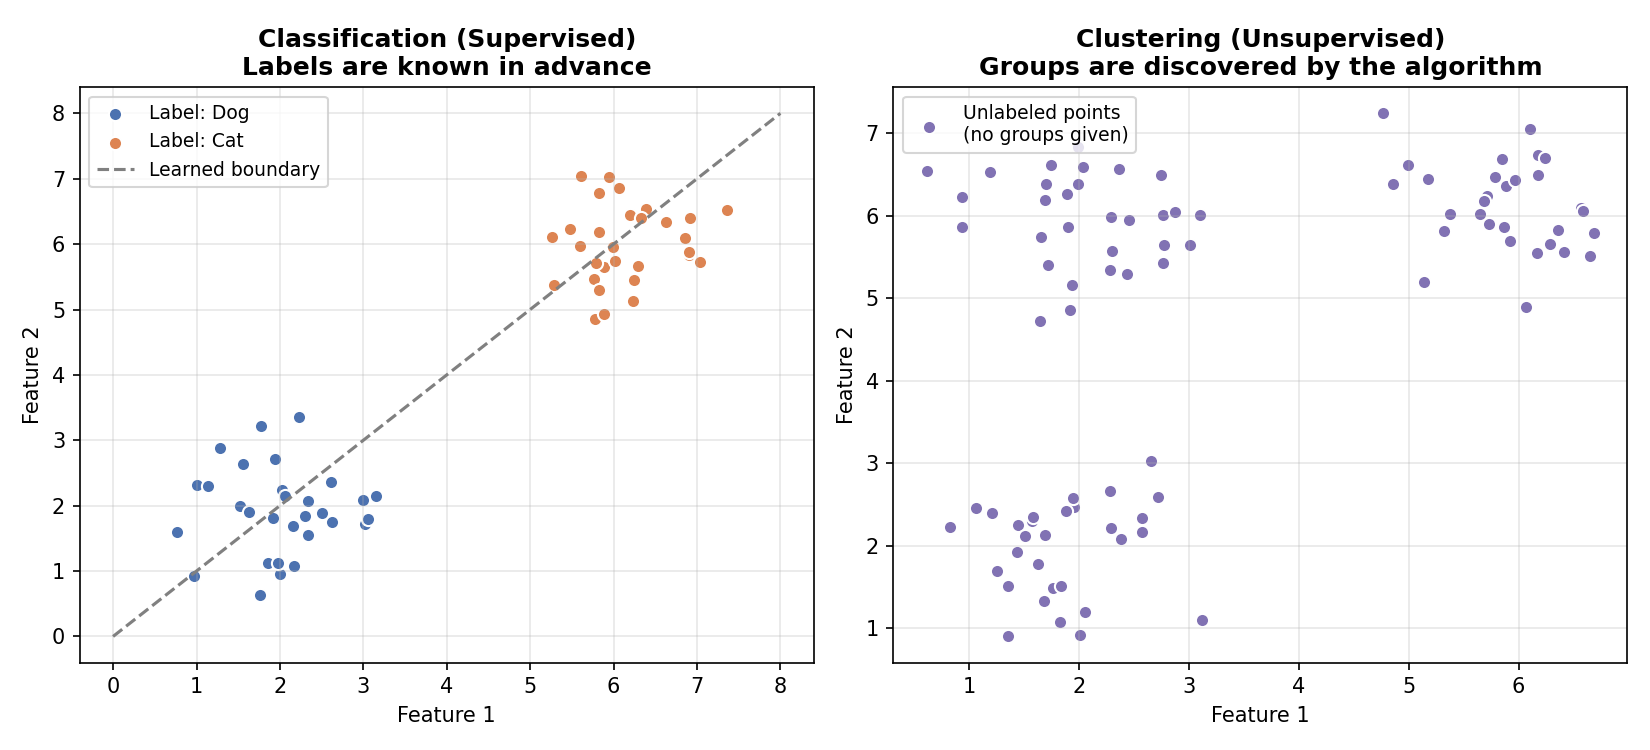 Figure 1: On the left, classification uses pre-labeled examples (Dog vs. Cat) to learn a decision boundary. On the right, clustering has no labels at all — the algorithm groups similar points together and the analyst decides afterward what each group means.
Comparison Table
| Aspect | Classification | Clustering |
|---|---|---|
| Type | Supervised learning | Unsupervised learning |
| Input data | Labeled data (classes are already known) | Unlabeled data (no predefined classes) |
| Goal | Learn from known classes, then predict the class of new, unseen data | Discover hidden groups or structure within the existing data |
| Nature | Descriptive prediction — assigns new items to known categories | Predictive analytics — reveals previously unknown groupings |
| End goal | Find a rule that correctly separates known classes | Create meaningful, distinct (heterogeneous) subsets from a single dataset |
| Common algorithms | Logistic Regression, Decision Trees, Random Forest | K-Means Clustering, Fuzzy C-Means, Hierarchical Clustering, DBSCAN |
| Simple analogy | A teacher grading essays into "Pass" or "Fail" using a known rubric | A teacher looking at a pile of ungraded essays and noticing that they naturally fall into "strong," "average," and "weak" writing styles without a rubric |
In plain terms: Classification is like sorting mail into mailboxes that already have names on them. Clustering is like sorting a pile of unlabeled mail and figuring out, based on similarities, how many "types" of mail there even are, and what each pile probably represents.
Real-Life (Dummy) Examples in Retail & Commerce
To make this concrete, here are four fictional examples showing how clustering plays out in a retail/e-commerce setting. None of these are real companies, they are illustrative scenarios.
1. ShopNest - Customer Segmentation for Marketing
Fictional company: ShopNest, an online fashion retailer.
Input data: Annual spend per customer, number of purchases per year, average basket size, browsing time on site.
What clustering finds: Three clusters emerge based on the data:
- Cluster A – "Frequent Bargain Shoppers": Visit often, buy small amounts each time.
- Cluster B – "Premium Occasional Buyers": Rarely visit, but spend a lot per order.
- Cluster C – "Steady Regulars": Moderate frequency and moderate spend.
Business Insight: ShopNest's marketing team should builds 3 different email campaigns 1. flash-sale alerts for Cluster A, 2. early access to luxury drops for Cluster B, and 3. loyalty-point reminders for Cluster C, instead of blasting the same generic email to everyone.
2. GroceryCart - Market Basket Grouping
Fictional company: GroceryCart, a fictional grocery delivery app.
Input data: Items purchased together in a single order across thousands of baskets.
What clustering finds: A cluster of baskets heavy in pasta, sauce, and cheese; another cluster dominated by baby food, diapers, and wipes; another built around fitness snacks and protein powder.
Business Insight: GroceryCart uses these clusters to redesign its homepage "Recommended for You" section and to plan bundle discounts (e.g., a "Family Night Pasta Bundle").
3. TrendCart - Detecting Fraudulent Orders (Anomaly Detection)
Fictional company: TrendCart, a fictional electronics marketplace.
Input data: Order value, shipping address distance from billing address, time of purchase, device fingerprint.
What clustering finds: Most orders fall into a few large, dense clusters representing "normal" shopping behavior. A small number of orders sit far outside any cluster, unusually large order value, mismatched shipping/billing location, purchase made at 3 a.m.
Business Insight: Those outlier points are flagged for manual fraud review before the order ships, since they don't resemble any typical customer behavior pattern.
4. ClothWell - Store Layout & Regional Demand Planning
Fictional company: ClothWell, a fictional chain of clothing stores.
Input data: Store-level sales by category (activewear, formalwear, outerwear, accessories) across 200 store locations.
What clustering finds: Stores cluster into groups such as "cold-climate, outerwear-heavy stores," "urban, formalwear-heavy stores," and "suburban, activewear-heavy stores", even though no one explicitly labeled stores this way.
Business Insight: ClothWell adjusts inventory allocation per cluster instead of shipping identical stock to every store, reducing overstock of winter coats in warm-climate locations.
Visualizing Clustering: How to Read a Cluster Plot
One of the best ways to understand clustering is to see it. Below is a scatter plot from our fictional ShopNest example.
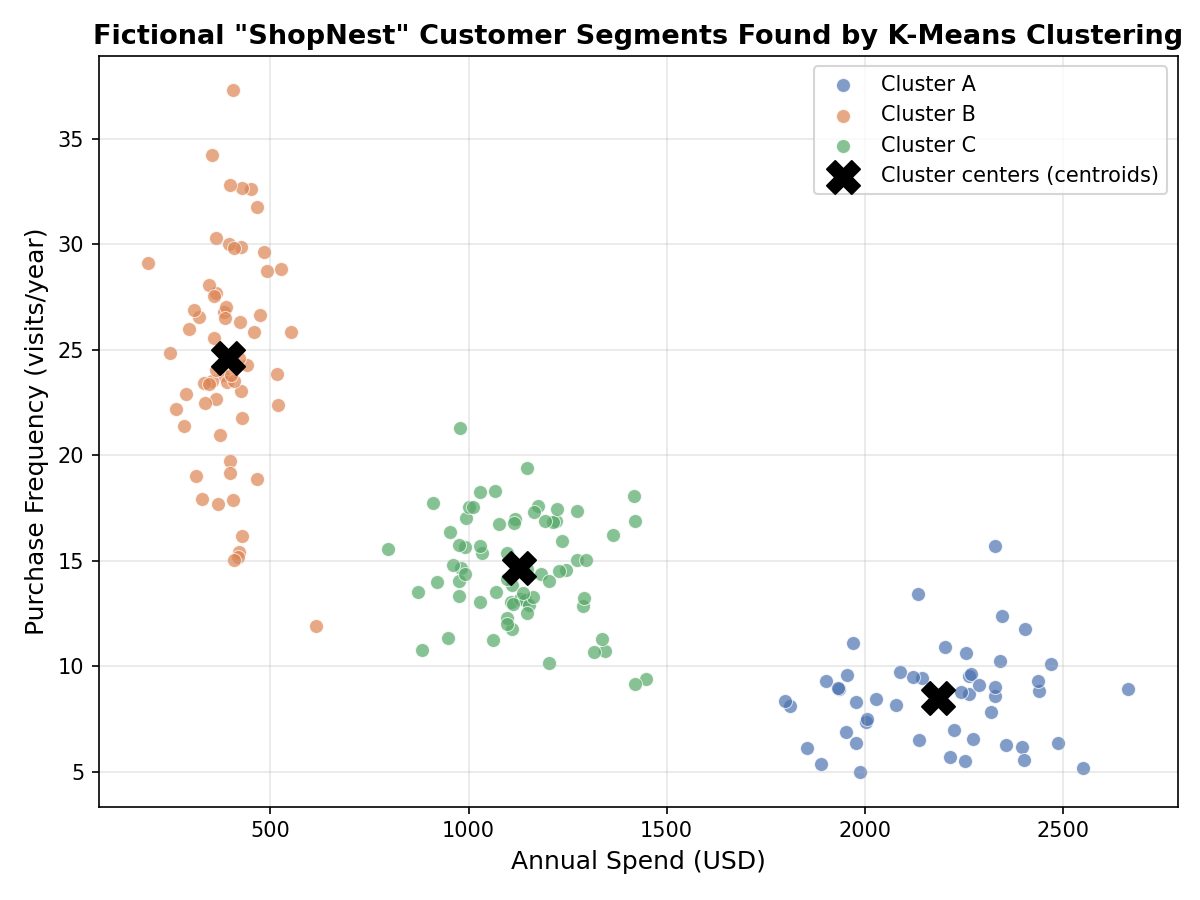 Figure 2: Each dot represents one fictional ShopNest customer. Color indicates which cluster the K-Means algorithm assigned them to. Black "X" markers show the centroid — the mathematical center — of each cluster.
How to Read This Chart
- X-axis: Annual Spend (in USD), how much a customer spends per year.
- Y-axis: Purchase Frequency, how many times per year they buy something.
- Color: Each color represents a distinct cluster discovered by the algorithm (Cluster A, B, or C) — not something predefined by a human.
- Black "X" markers: The centroid of each cluster, essentially the "average" customer within that group, used by algorithms like K-Means to represent the center of that cluster.
- Pattern to notice: Points that are close together on both axes tend to land in the same cluster, because they behave similarly. Notice how Cluster A (frequent, low-spend) sits far from Cluster B (infrequent, high-spend), they are on opposite ends of the chart, which is exactly why the algorithm treats them as separate groups.
How to Build This Yourself
If you want to create a similar visualization with your own data:
1. Pick two numeric features that describe your data points (e.g., spend and frequency, or age and income).
2. Choose the number of clusters (k), start with a reasonable guess like 3, or use a method like the "elbow method" to help decide.
3. Run a clustering algorithm such as K-Means on your dataset using those two features.
4. Plot the data on a standard XY scatter plot, using one axis per feature.
5. Color each point according to the cluster label the algorithm assigned it.
6. Plot the centroids (the algorithm typically returns these) as a distinct marker, like an X or star, so viewers can see the "center" of each group.
7. Label your axes clearly and add a legend so cluster colors are easy to interpret.
Key Applications of Clustering
1. Customer Segmentation / Targeted Advertising: Businesses use clustering to group customers by shared behavior — web activity, purchase history, or demographics. Each segment can then be targeted with tailored marketing strategies instead of one-size-fits-all campaigns.
2. Anomaly Detection: Clustering can reveal hidden patterns in data, and points that don't fit neatly into any cluster often represent anomalies — such as fraudulent transactions, defective products, or unusual system behavior.
3. Market Basket Analysis: Grouping similar purchase patterns to inform product bundling and recommendations.
4. Operational Planning: Grouping stores, warehouses, or regions by similar demand patterns to optimize inventory and logistics.
Summary
- Clustering is an unsupervised technique that groups data into clusters based on similarity — without predefined labels.
- It differs fundamentally from classification, which relies on labeled data to predict known categories.
- Common algorithms include K-Means and Fuzzy C-Means, among others.
- In retail and commerce, clustering powers customer segmentation, market basket analysis, fraud/anomaly detection, and demand planning.
- Visualizing clusters (like the scatter plot above) makes it much easier to interpret and communicate what the algorithm found — especially to non-technical stakeholders.
Whether you are a data science professional refining segmentation models or a student just getting your feet wet with unsupervised learning, clustering is a foundational tool worth mastering, it turns unlabeled chaos into actionable structure.