Analytics
Synthetic Control: The Core Idea with a Easy to understand Example
Part 1 of 3: what Synthetic Control is, why it beats before-vs-after and single control-city tests, with a hand-checkable free-delivery example.
In this artciles series "Synthetic Control" we are going to explore the Synthetic Control method. This series consist of 3 parts
- Part 1 covers the core idea
- Part 2: Result and Validation (Answers: How to you trust the output?),
- Part 3: Pitfalls, Limitations, and Metrics (Answers: Loopholes to avoid).
Let's jump straight into the core idea behind Synthetic Control, and why it is better than before-vs-after and single control-city tests.
Consider a campaign being run with 3 different methods to estimate the counterfactual. The first method is a simple before-vs-after comparison, the second method is a single control city, and the third method is Synthetic Control.
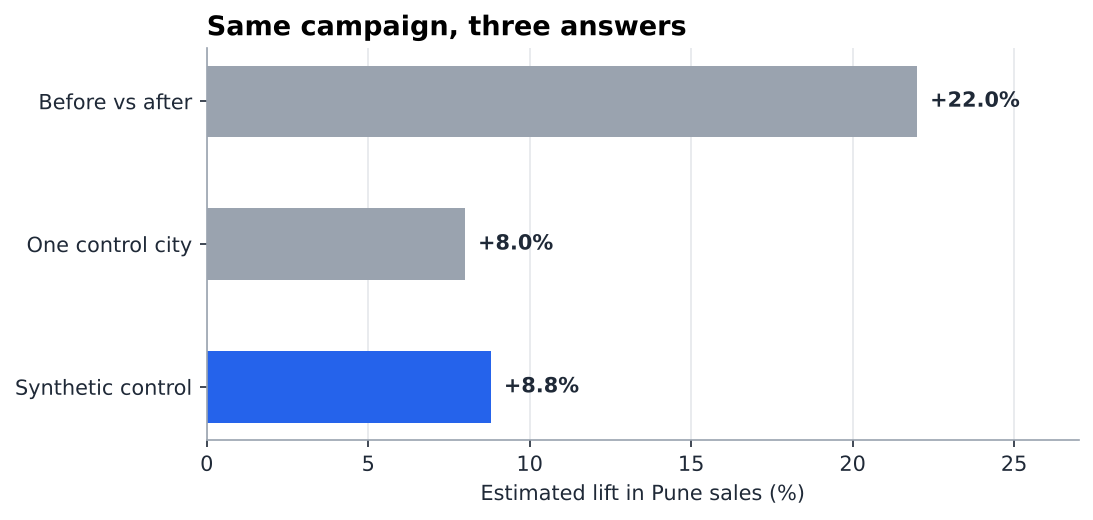
Same campaign, three answers. Only one of them is a trap.
The Why Behind the Measurement: Every business spends money on things it hopes will grow sales, like a discount, a new store, a TV campaign, a loyalty programme. A few weeks later, sales are up. Then the finance head asks the question that decides next year's budget:
"Would we have sold this much anyway?"
That question is hard to answer for the following 3 reasons:
- Markets move on their own. Festivals, salary cycles, weather and competitors push sales up and down whether or not you do anything.
- You often cannot test everywhere. A launch in one city or region is common, and you cannot randomly split customers inside it.
- You only live one version of events (or offers). You see sales with the campaign, never sales without it.
That missing "without" number is called the counterfactual: what would have happened if you had done nothing. Every campaign measurement is really an attempt to estimate it. This series shows one of the best ways to do that when you can only test in one place.
Take a simple case. A grocery app launches free delivery in one city. Sales jump. How much of that jump came from the campaign?
Jargon check
- Counterfactual: What would have happened without the campaign. We can never observe it, so we estimate it.
- Test city (treated city): The city that got the campaign. Here, Pune.
- Donor cities (control cities): Cities that did not get the campaign. We borrow from them to build the estimate.
- Pre-period / post-period: The weeks before launch, and the weeks during or after it.
- Synthetic control: A "virtual city" built as a weighted mix of donor cities, designed to behave like the test city before launch.
- Difference-in-Differences (DiD): Compare how much the test city changed against how much a control city changed over the same weeks.
- Lift: The extra sales caused by the campaign, in INR or as a percentage.
- RMSPE (Root Mean Squared Prediction Error): A measure of how far predictions are from reality, in the same units as sales. Formula:
RMSPE = sqrt( average of (Actual − Predicted)² ). In words: square each week's error, average them, take the square root. Smaller means the virtual city tracks the real one better. Part 2 works through an example.- Rs lakh: 1 lakh = 100,000 rupees.
Two ways to estimate the counterfactual
Control-based testing. Pick one or a few "similar" cities that got no campaign and compare. The weakness: no city is truly similar. Mumbai is not Bengaluru, and the gap between two cities drifts for reasons unrelated to your campaign.
Synthetic Control. Build a fake city from a weighted mix of many untreated cities. The weights are chosen so the fake city tracks the real one as closely as possible before launch. After launch, the fake city shows what would have happened without the campaign and the actual city shows the sales with the campaign. The gap is the campaign effect.
An analogy
Riya joins a coaching class two months before her final exam and scores 82.
Did the coaching help, or was the paper simply easy that year?
Her classmates who skipped coaching also did better this time, so comparing Riya with her own old scores wouldn't be appropriate. Picking one friend as the comparison is unfair too, because no single student is exactly like Riya.
So you blend. Look at her mock-test marks over the past year and find a mix of students without coaching whose marks moved just like hers: Let' say 50% of Aman, 30% of Neha and 20% of Kabir. That mix is Riya's synthetic twin (Someone with similar characteristics like Riya but without the coaching).
On the final exam, the synthetic twin scores 74 whereas Riya scored 82. The easy paper lifted both of them, so the 8-mark gap is what the coaching added. In this series, Riya is the test city, her classmates are the donor cities, and the twin's 74 is the counterfactual.
The example: free delivery in Pune
FreshKart is a fictional grocery app. It launches free delivery in Pune for 3 weeks (weeks 6 to 8). Weeks 1 to 5 are the "before" period. Nagpur, Indore and Surat had no campaign. Numbers are weekly sales in Rs lakh, made up so you can check every step.
| Week | Period | Pune (test) | Nagpur | Indore | Surat |
|---|---|---|---|---|---|
| W1 | Before | 101 | 110 | 90 | 90 |
| W2 | Before | 99 | 104 | 100 | 90 |
| W3 | Before | 112 | 120 | 100 | 100 |
| W4 | Before | 110 | 116 | 110 | 100 |
| W5 | Before | 119 | 130 | 110 | 110 |
| W6 | Campaign | 125 | 124 | 110 | 100 |
| W7 | Campaign | 133 | 130 | 120 | 110 |
| W8 | Campaign | 138 | 136 | 120 | 110 |
Pune sold 396 (125+133+138) in the campaign weeks. What would it have sold anyway?
| Before vs. After | One control city | Synthetic control | |
|---|---|---|---|
| Idea | Compare Pune with its own past | Compare Pune with Nagpur | Blend several cities into a "virtual Pune" |
| Accounts for market growth? | No | Partly | Yes |
| Accounts for festivals? | No | Only if Nagpur behaves like Pune | Yes, the blend is fitted to Pune |
| Result | +22.0% (overstated) | +8.0% | +8.8% |
Method 1: Before vs. After
Before vs. after credits the campaign with 22%. But every city grew in those weeks. Roughly 13% of the 22% points were the standard market growth i.e. not influenced by free delivery.
Method 2: The Control City
Nagpur usually sells a bit more than Pune. Measure that usual gap before launch, then check whether it changed during the campaign. This is Difference-in-Differences (DiD).
| Week | Pune | Nagpur | Gap |
|---|---|---|---|
| W1 | 101 | 110 | -9 |
| W2 | 99 | 104 | -5 |
| W3 | 112 | 120 | -8 |
| W4 | 110 | 116 | -6 |
| W5 | 119 | 130 | -11 |
| Average | -7.8 |
Pune without the campaign is estimated as Nagpur minus the usual gap of 7.8. For W6, W7 and W8 that gives 116.2 (Nagpur's 124 − 7.8), 122.2 and 128.2, a total of 366.6. Pune actually sold 396, so the lift is 29.4 (396 − 366.6), or 8.0%.
| Week | Nagpur actual | Minus average gap | Pune without campaign | Pune actual | Lift |
|---|---|---|---|---|---|
| W6 | 124 | − 7.8 | 116.2 | 125 | 8.8 |
| W7 | 130 | − 7.8 | 122.2 | 133 | 10.8 |
| W8 | 136 | − 7.8 | 128.2 | 138 | 9.8 |
| Total | 390 | 366.6 | 396 | 29.4 |
But the gap swung between -5 (W2) and -11 (W5), so considering only one city for comparison is a noisy yardstick.
Method 3: The Synthetic City
No single city looks like Pune, but a mix can. The algorithm tries many weight combinations and keeps the one that best reproduces Pune's before-period sales. Weights are never negative and add up to 100%. For simplication purposes we use 50% Nagpur, 30% Indore, 20% Surat.
| Week | Synthetic Pune | Actual Pune |
|---|---|---|
| W1 | 100 | 101 |
| W2 | 100 | 99 |
| W3 | 110 | 112 |
| W4 | 111 | 110 |
| W5 | 120 | 119 |
| W6 | 115 | 125 |
| W7 | 123 | 133 |
| W8 | 126 | 138 |
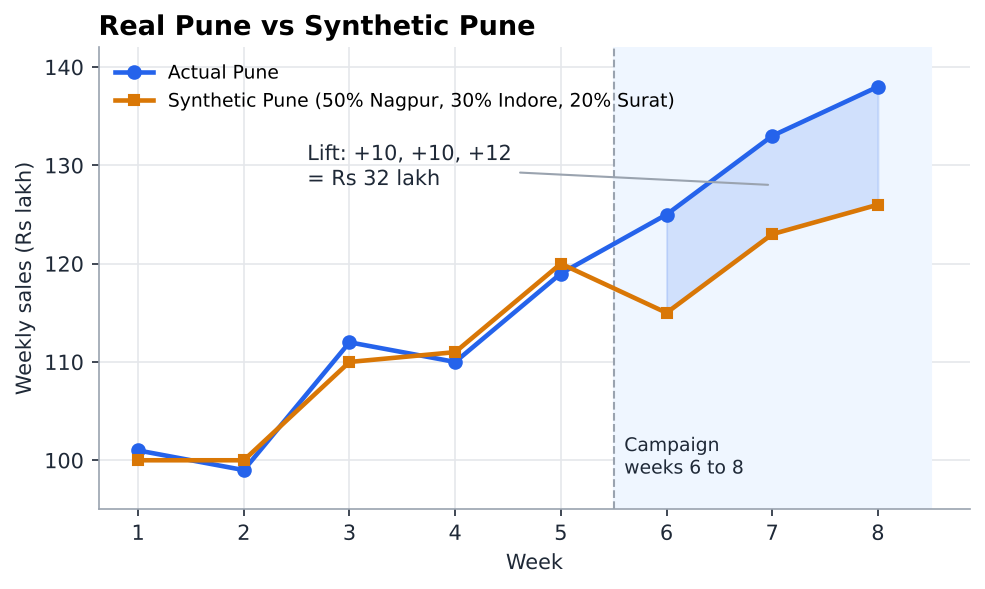
Real Pune vs. Synthetic Pune. The lines overlap before launch, then separate.
- Shaded band: Campaign weeks.
- Shaded gap: The campaign effect.
In weeks 1 to 5 the lines stay within 1 to 2 units. That is the evidence the virtual city is a trustworthy stand-in. The lift is a plain difference: +10, +10, +12, so Rs 32 lakh, or 32 divided by 364 = 8.8%.
Control city vs. Synthetic Control
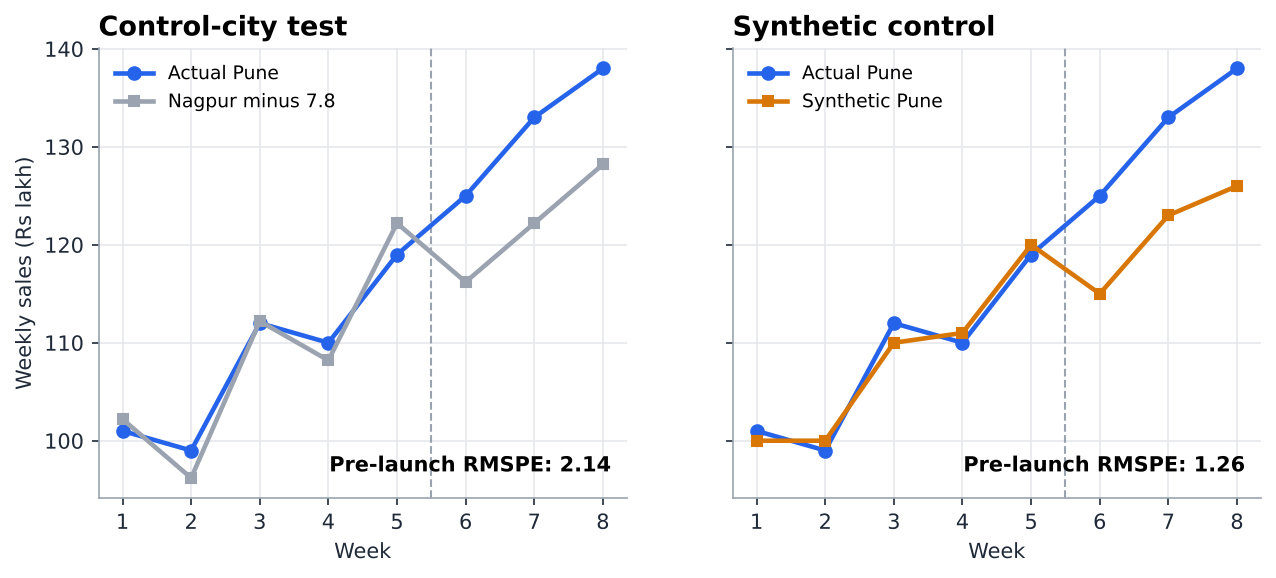
Left: One control city. | Right: Synthetic Pune. | The right panel hugs the blue line more closely before launch.
| Single control city | Synthetic control | |
|---|---|---|
| Built from | One look-alike | A weighted blend |
| Weights chosen by | Judgement | Algorithm, fitted on pre-launch sales |
| Pre-launch error (RMSPE) | 2.14 | 1.26 |
| Sensitive to one city's quirks? | Very | Much less |
RMSPE is the typical size of the model's miss in a normal week. Part 2 explains how to calculate the RMSPE.
Key takeaways
- Every campaign test is really a search for the counterfactual.
- Before vs. after mixes your campaign with market growth.
- Synthetic Control blends untreated cities, fitted on pre-launch history, into a "virtual twin".
- The effect is a simple difference: actual minus synthetic.
Next: Part 2, Result and Validation
Which campaign at your company would you test with a synthetic city first? Tell me in the comments