Analytics
Synthetic DiD: Core Idea and Why It Fixes Synthetic Control
Part 1 of 3: why Synthetic Control breaks when your test city is the biggest, and the three ingredients Synthetic Difference-in-Differences adds to fix it.
In this artciles series "Synthetic Difference-in-Differences" we will understand what are the gaps in SCM and how SDiD fixes. This series consist of 3 parts
- Part 1 covers the core idea and the reason why SDID fixes the gaps in SCM.
- Part 2 - Working Example : Focuses logical , explanation of time weights, and a working example.,
- Part 3 - Pitfalls and Limitations : Let us understand Pitfalls and Limitations of SCM and SDID and when to use which.
Jargon check
- Counterfactual: What would have happened without the campaign. Both methods in this series estimate it.
- Synthetic Control (SCM): Blend donor cities so the blend matches the test city's sales level before launch.
- Difference-in-Differences (DiD): Compare the test city's change over time with a control group's change over the same period.
- Convex hull: The range of results you can build by blending donors. A city bigger than every donor sits outside it.
- Intercept: A fixed amount added to the blend so it only has to match ups and downs, not size.
- Ridge penalty: A small cost for leaning too hard on one donor, which spreads weight across more cities.
- Time weights: Weights on weeks (not cities) that pick the pre-launch weeks most like the campaign weeks.
- Parallel trends: The assumption that, without the campaign, the test and comparison cities would have moved in step.
In the Synthetic Control series we built a virtual Pune from smaller cities. It worked because Pune sat inside the range of our donors.
Here is a scenario where Synthetic Control fails: the test city is the biggest of all, say a metro tested against tier-2 cities. No blend of smaller cities can add up to one bigger city.
Synthetic Difference-in-Differences (SDID) fixes this. It keeps Synthetic Control's weighted blend and borrows the idea behind Difference-in-Differences: compare changes, not levels.
Difference-in-Differences in 60 seconds
SDID is half Difference-in-Differences (DiD) and half Synthetic Control. Let's understand the Difference-in-Differences quicly here. We use the Pune vs Nagpur numbers from the Synthetic Control series (weekly sales, Rs lakh).
| Before (avg W1 to W5) | Campaign (avg W6 to W8) | Change | |
|---|---|---|---|
| Pune (test) | 108.2 | 132.0 | +23.8 |
| Nagpur (comparison) | 116.0 | 130.0 | +14.0 |
| Difference of changes | +9.8 per week |
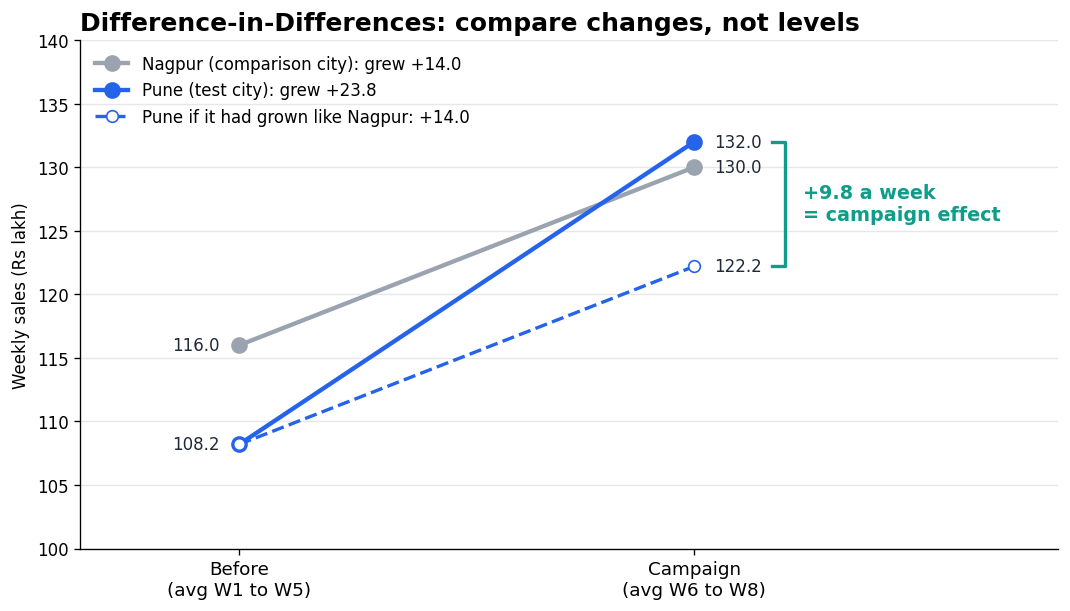
The dashed line is Pune if it had grown like Nagpur. The gap at the end is the campaign effect.
- First difference: how much each city changed from before to campaign.
- Pune (Post Launch) − Pune (Pre Launch) = 132.0 − 108.2 = +23.8. Let's call this Pune (delta)
- Nagpur (Post Launch) − Nagpur (Pre Launch) = 130.0 − 116.0 = +14.0. Let's call this Nagpur (delta)
- Second difference: Pune's change minus Nagpur's change.
- Pune (delta) − Nagpur (delta) = 23.8 − 14.0 = +9.8.
- Nagpur's +14 is what the season did anyway, so the extra +9.8 a week (29.4 over three weeks, 8.0% lift) is credited to the campaign.
- Notice that Nagpur is bigger than Pune and that is fine. DiD never asks the two cities to be the same size, only to move in step.
- Parallel trends is the assumption behind this. Without the campaign, Pune would have grown by the same +14 as Nagpur.
DiD has two weaknesses, and each one maps to an SDID fix:
| DiD weakness | SDID fix |
|---|---|
| One comparison city is noisy. The Pune-Nagpur gap swung from -5 to -11 before launch | Replace Nagpur with a weighted blend of donor cities, as Synthetic Control does |
| Every "before" week counts equally. W1 counts as much as W5, even if W1 looks nothing like the campaign weeks | Time weights pick the "before" weeks that look most like the campaign weeks |
SCM vs SDID: The one-line difference
- Synthetic Control asks: Can I rebuild this city exactly?
- SDID asks: Can I rebuild how this city moves, then compare changes?
An analogy: Assume you want to copy a friend's workout progress.
- Synthetic Control insists you lift the same weights as your friend every week.
- SDID only needs your progress to rise and fall in step, even if you lift 20 kg less in total. That fixed 20 kg gap is allowed, then ignored.
Challenges with Synthetic Control
Look at the chart below. The grey lines are 25 donor cities. The blue line is a test city larger than all of them.
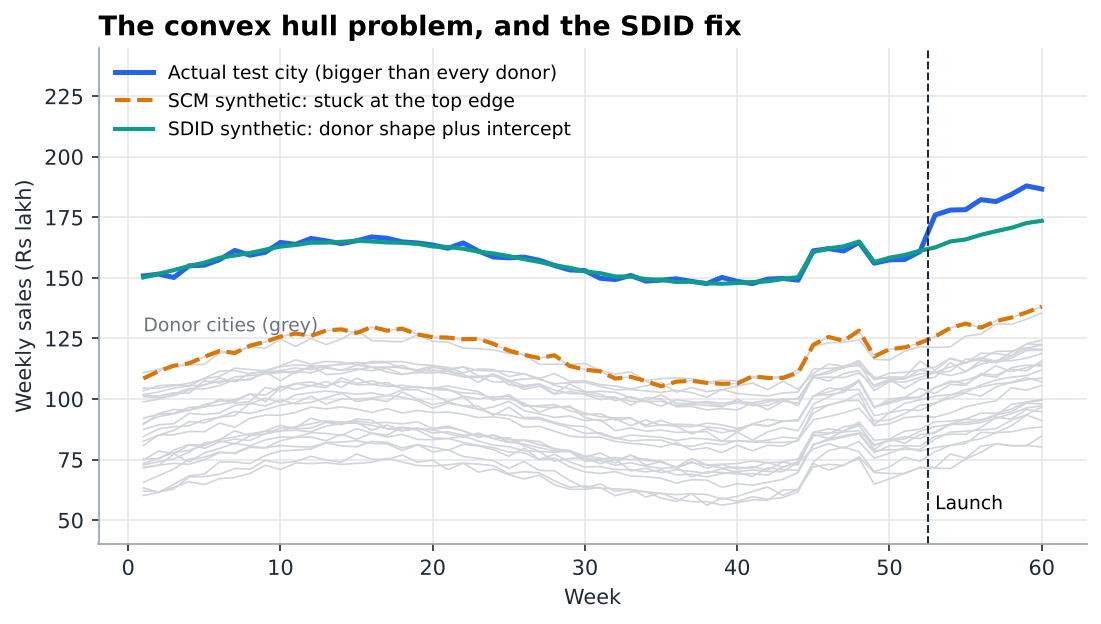
The test city (blue) is bigger than every donor. Synthetic Control (orange) cannot reach it. Synthetic DiD (green) can.
- Synthetic Control blends donors with weights of at least zero that add to 1. Its answer can never rise above the highest donor, so the orange dashed line is stuck at the top edge.
- That mismatch before launch becomes bias after launch.
In our simulation the true campaign lift was 8%.
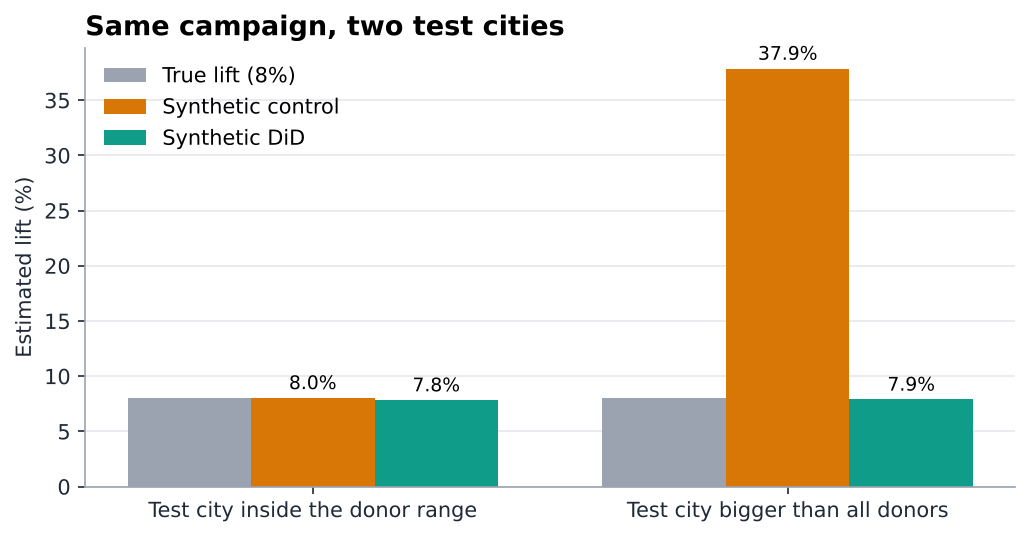
Simulated data.
Left chart: Test city inside the donor range, both methods are right.
Right Chart: test city bigger than every donor, Synthetic Control says 37.9%, SDID says 7.9%.
Three logical improvements SDID adds to Synthetic Control
| Ingredient | In plain words | Why it helps |
|---|---|---|
| Intercept | "Test city = blend of donors + a fixed amount" | The blend only matches the ups and downs, not the size |
| Ridge penalty | A small cost for leaning too hard on one city | Weights spread across more cities, so one donor's local event matters less |
| Time weights | A second set of weights, on weeks | Picks the pre-launch weeks most like the campaign weeks as the baseline |
Time weights tell SDID which pre-launch weeks to use as the "before" baseline. SDID looks at the untreated donor cities and finds the blend of pre-launch weeks that best predicts what they sold during the campaign weeks. Weeks that look like the campaign period get more weight. Old or unusual weeks, like a holiday spike, count for little.
SDID: Time weights, explained
The leadership version. A new store manager starts in December and sales jump. To judge them, you would not compare December with last February. You would compare it with the weeks that normally behave like December, such as the run-up to the holidays. Time weights make that choice automatically, using data instead of judgement.
The mirror idea. Synthetic Control builds a fake city out of donor cities. Time weights use the same trick turned sideways: they build a fake "before period" out of pre-launch weeks.
| City weights | Time weights | |
|---|---|---|
| What gets a weight | Donor cities | Pre-launch weeks |
| What they build | A synthetic city that moves like the test city | A synthetic "before period" that looks like the campaign period |
| Question asked | Which mix of cities tracks the test city before launch? | Which mix of pre-launch weeks best predicts the donor cities' campaign weeks? |
| Data used | Pre-launch weeks only | Donor cities only |
| What is kept out | Campaign weeks, because they contain the effect | The test city, because its campaign weeks contain the effect |
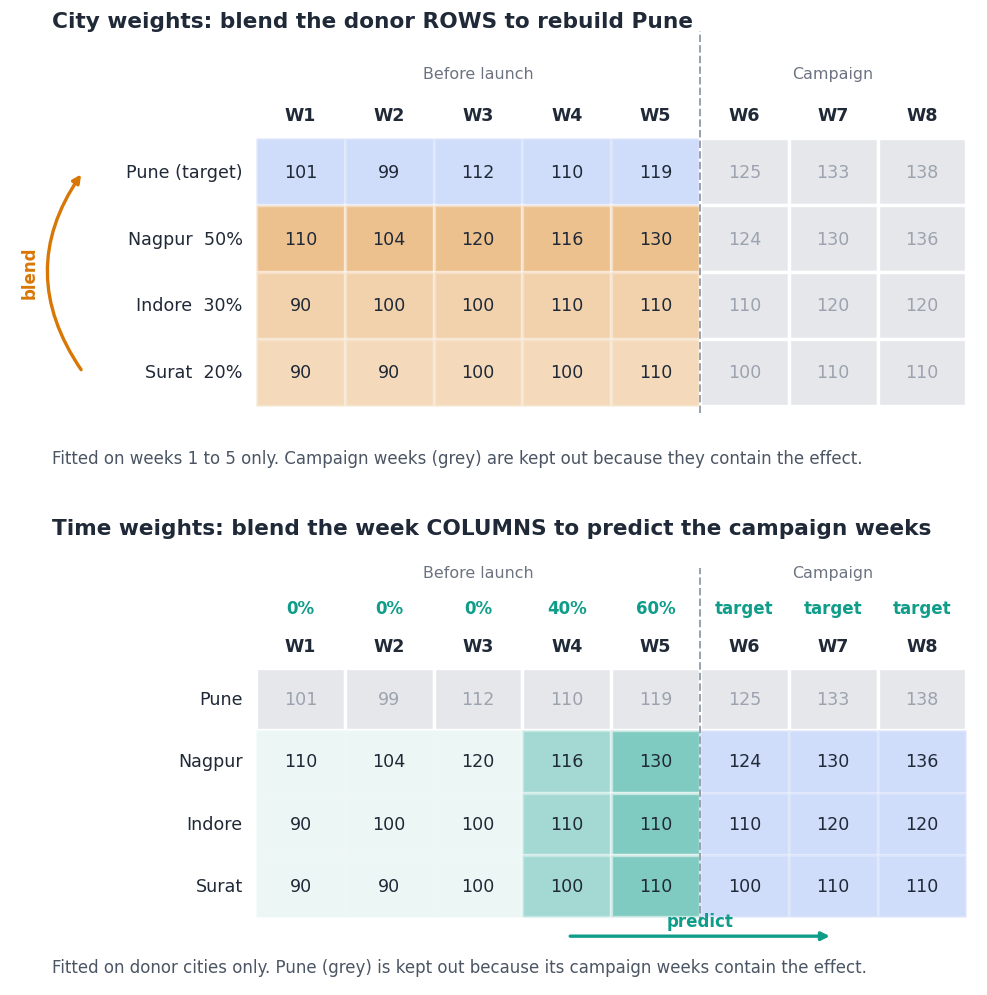
Same table, two directions. City weights blend rows. Time weights blend columns.
How they are chosen. Donor cities never got the campaign, so their campaign weeks show what "normal" looks like in that period. SDID searches for the mix of pre-launch weeks that best reproduces those donor campaign weeks. Like city weights, time weights are never negative and add up to 100%. They also get their own intercept, so a week does not need the same sales level as the campaign weeks, only the same pattern across cities.
Why they change the answer. The test city and its synthetic version are rarely an exact match. There is a "usual gap" between them, and SDID subtracts it. Time weights decide which weeks define "usual". In Part 2 - Working Example, counting all five pre-launch weeks equally gives Pune an 8.8% lift. Using the recent weeks that SDID favours gives 9.7%, because Pune ran slightly below its blend in exactly those weeks.
Putting it together: the weighted double difference
The final effect uses the same box as DiD above, with two upgrades: Nagpur becomes the synthetic city, and the "before" column becomes a time-weighted average instead of a plain average.
- Take the test city's change from the time-weighted "before" weeks to the campaign weeks.
- Take the synthetic city's change (the blend of donor cities) over the same period.
- Subtract the second from the first.
What is left is the campaign.
Comparison: SCM vs SDID
| Aspect | Synthetic Control (SCM) | Synthetic DiD (SDID) |
|---|---|---|
| Core question | Can I rebuild this city exactly? | Can I rebuild how this city moves? |
| Origin | Abadie, Diamond and Hainmueller (2003, 2010) | Arkhangelsky, Athey, Hirshberg, Imbens and Wager (2021) |
| What it matches | Exact level, week by week | Shape. A constant level gap is allowed |
| Intercept | No | Yes |
| Weights on cities | Sparse (3 to 6 cities) | Spread out by the ridge penalty |
| Weights on weeks | None | Yes |
| Effect formula | Average of actual minus synthetic | Weighted double difference |
| Inference | Placebo rank and p-value | Placebo variance, jackknife or bootstrap, giving standard errors and intervals |
| Several test cities | Fit each separately | Handled natively |
| Pre-launch fit | Usually the tightest | Slightly looser by design |
| Best when | Test city sits inside the donors | Test city is bigger, smaller or more seasonal than the donors |
Key takeaways
- Synthetic Control matches the test city's sales level, so it breaks when the test city is bigger or smaller than every donor.
- SDID matches only the city's ups and downs, so a size gap between the test city and donors doesn't matter.
- SDID has three upgrades over SCM: an intercept (absorbs size), a ridge penalty (spreads weights), time weights (picks relevant weeks).
- Time weights are city weights turned sideways: they build a "before period" from pre-launch weeks, and they decide which weeks define the usual gap that gets subtracted.
- The final effect is a DiD box with a blended comparison city and a time-weighted "before" column.
- In our simulation, Synthetic Control reported 37.9% where the truth was 8%, and SDID reported 7.9%.
Next: Part 2, the Pune example reworked with Python code.
Which of your campaigns has a test city bigger than any donor you could pick? Share it in the comments, and subscribe for Part 2.