Analytics
Synthetic DiD: Strength and Pitfalls
Part 3 of 3: Advantages and pitfalls of Synthetic Control and Synthetic DiD, how to read time weights, and a decision table for choosing a method.
Jargon check
- Counterfactual: What would have happened without the campaign.
- Confidence interval: A range that likely contains the true effect, such as 3.6% to 16.3%.
- Standard error: How much the estimate would typically wobble from sample to sample. Smaller means more precise.
- Placebo rank: Where the real test city sits when ranked against untreated cities pretending to be treated.
- Seasonality: Regular patterns in sales, such as festivals, paydays and weekends.
- Staggered launch: Cities launching the campaign on different dates.
- Cohort: A group of cities that launched on the same date.
- Level gap: The constant difference in size between the test city and its synthetic version.
This final part helps to understand what to inspect before trusting the results, and lists the traps.
Time weights
The chart below shows SDID's week weights from our simulation.
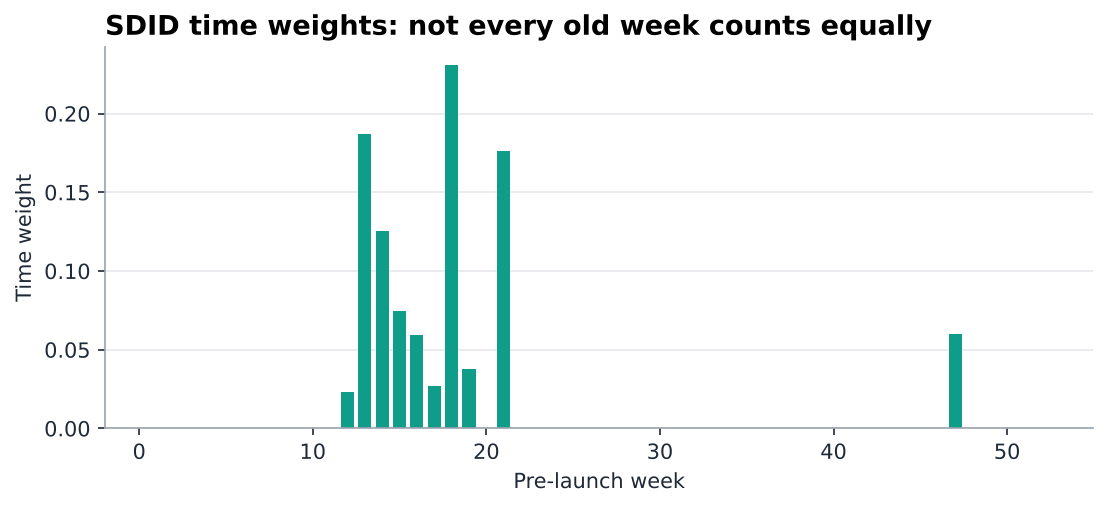
Time weights from the simulation. A handful of weeks carry all the weight.
- Weights add up to 1.
- Tall bars: weeks that behave most like the post-launch period for untreated cities.
- Zero bars: weeks ignored.
- Here weeks 13 to 21 plus week 47 carry all the weight. These are the weeks whose donor-city pattern best predicts the post-launch period. In a seasonal business that usually means weeks from a similar season, not simply the most recent ones.
If a tall bar sits on an unusual week such as a festival or an outage, be suspicious, because that week then defines your baseline.
A good way to cross the above weights is to run an in-time placebo: pretend the campaign started a few weeks earlier, use only pre-launch data, and rerun SDID. Nothing happened in those weeks, so it should find roughly zero lift. If it finds a sizeable "effect" where there was none, the baseline the time weights picked is not reliable.
Synthetic Control: strengths and pitfalls
| Advantage | Pitfall | Mitigation |
|---|---|---|
| Very interpretable ("Synthetic Indore = 40% Nagpur + 35% Bhopal + 25% Jaipur") | Convex hull problem for the biggest or smallest city | Index sales to the pre-period mean, use logs, or switch to SDID |
| No extrapolation | Sparse weights: one or two donors dominate | Leave-one-out test |
| Tight pre-launch fit when a match exists | Overfitting with many donors and a short history | 52+ pre-weeks, 10 to 25 donors, holdout |
| Does not assume parallel trends | No standard error | Bigger donor pool, conformal inference or SDID |
SDID: strengths and pitfalls
| Advantage | Pitfall | Mitigation |
|---|---|---|
| Handles size differences via the intercept | The intercept can hide a bad match | Always inspect the pre-launch chart, not just the final number |
| Time weights focus on relevant weeks | Weights can land on a few weeks | Check which weeks got weight, run an in-time placebo |
| Ridge spreads weights across donors | Weights are harder to explain | Show the top 5 donors and group the rest |
| Standard errors and confidence intervals | Weak inference with one test city | Use two or more test cities, report the placebo rank as well |
Two more SDID caveats.
- It assumes the level gap stays constant, so plot the pre-launch gap and check it is flat.
- Python tooling is less mature than the R package
synthdid, so validate a custom version against R on the same data.
Fictional scenarios where SDID works
Retail: UrbanCart tests a loyalty launch in its biggest metro. The metro is larger than every donor, so Synthetic Control cannot match it. With SDID the intercept absorbs the size gap, the pre-launch lines align and the lift is believable.
Finance: NorthStar Pay rolls out cashback in three cities at once. SDID handles several test cities natively, which tightens the confidence interval compared with three separate single-city tests.
Healthcare: CareLoop launches a reminder feature in festival season. Bookings shift sharply around festivals. Time weights pick pre-weeks with a similar seasonal shape, so the festival bump is not credited to the feature.
Which one to use
| Situation | Better choice | Reason |
|---|---|---|
| One test city, similar size to donors, long clean history | SCM | Tight fit and the easiest story |
| Test city is the biggest or smallest | SDID | The intercept solves the convex hull problem |
| Leadership wants to see which cities form the control | SCM | Sparse, readable weights |
| Leadership wants a confidence range | SDID | Standard errors and intervals |
| Several test cities launching together | SDID | Native support, tighter intervals |
| Strong seasonality or a festival near launch | SDID | Time weights pick comparable weeks |
| Short history (under 26 weeks) | SDID, with caution | Regularisation reduces overfitting |
| High-stakes decision | Both | If they agree, confidence is high. If not, investigate first |
Run both and compare
In our simulation with a Pune-like city, all three methods recovered roughly the true 8% (Synthetic Control 8.0%, SDID 7.8%, one-city DiD 8.1%). With the oversized city, Synthetic Control drifted to 37.9% while SDID held at 7.9%.
When different methods agree with results it is easy to showcase and the leadership can trust the result.
Key takeaways
- Choose Synthetic Control when you need readable weights and the test city sits inside the donors.
- Choose SDID when the city is the biggest or smallest, several cities launch together, or seasonality is strong.
- Inspect the pre-launch chart and the time weights. The intercept can make a poor match look fine.
- For important decisions, run both methods and a simple DiD side by side.
Full code: All the code behind this series is available on GitHub.
Back to the start: Synthetic Control, Part 1.