Projects
Purchase Propensity Modeling: A Beginner’s Guide to Predicting Customer Purchase Probabilities
Part 1 of 6 series to explain the problem statement and concept behind Purchase Propensity Model.
The article series at a glance
This series explain the concept of purchase propensity model from the first business conversation to a model running in production. Each article covers one stage of the process, so you can see where you are in the workflow and jump to the stage you would like to know more. There are 3 short standalone articles, listed under the table, explain the model evaluation concepts used along the way.
| Part | Stage | Article | What it covers |
|---|---|---|---|
| 1 | Concept | Purchase Propensity Modeling: A Beginner’s Guide to Predicting Customer Purchase Probabilities | Why blanket campaigns waste money, what a propensity model is, and how to state the problem precisely. |
| 2 | Design | Model Designing: Observation Window,Populations and Data Leakage | How to choose the observation and prediction windows, decide who belongs in the model, and prevent leakage before writing code. |
| 3 | Prepare | Data Preparation: Cleaning, Sessionizing, and Feature Engineering | Turning raw clickstream into a training table: cleaning, sessions, the target variable and feature engineering. |
| 4 | Train | Model Training: Logistic Regression, Random Forest, and LightGBM | Model training, a time-based split of the training data, three models compared on validation, and why one moves forward. |
| 5 | Test and target | Model Testing and Targeting: Lift, Calibration, and the Campaign Audience | Test the model, lift & gain, calibrated probabilities, and a campaign audience built with a break-even rule, and a holdout testing. |
| 6 | Operate | Impact and Production: Uplift, Architecture, and Monitoring | Propensity versus uplift, a production architecture, and monitoring for drift. |
Model Evaluation Concepts, standalone: Calibration | The Brier Score | SHAP
Why blanket campaigns waste money, and how a Purchase Propensity Model (PPM) changes that?
Background and context for the series of articles on building a PPM.:
- This article covers to explain the concept of (PPM) based on my experience I had in past.
- This is a 6 part series article to explain the concepts and working in detail.
- The article uses a fictional business scenario as one would encounter while building a PPM i.e. from the first leadership meeting to a monitored system, along with Python Code you can run yourself.
- Part 1 covers the business conversation, the ROI discussion, the problem statement and the model itself.
- The fictional business name is BrightCart, which is an online retailer with 500,000 active customers.
Marketing Leadership Meeting - The kind of conversation that starts every PPM project
Here is a condensed leadership discussion that could happen in any mid-to-large business.
| Role | What they say | What they really need |
|---|---|---|
| CMO | "Our campaign costs keep rising, but revenue per campaign is flat." | Better return on marketing spend |
| Head of CRM | "We blast the same offer to everyone. Customers are tired of it." | Fewer, more relevant messages |
| CFO | "Show me incremental revenue per dollar, not open rates." | Measurable, defensible impact |
| Head of Analytics | "We have the data. We lack a ranked list we can trust." | A model that produces a usable score |
Each person describes the same problem from their point of view: money goes out, and nobody can say which part of it worked.
Meera the CMO, closed the meeting with a direction →
- Stop blasting all the customers at once.
- Concentrate spend on customers who are close to a purchase at that moment.
Website Funnel - Top, middle, and bottom of the funnel
Marketers picture the buying journey as a funnel with three zones.
| Zone | Who is there | Typical behavior |
|---|---|---|
| Top of funnel (TOF) | People just becoming aware of you | Browse the home page, read a blog post |
| Middle of funnel (MOF) | People comparing options | View products, search, save to a wishlist |
| Bottom of funnel (BOF) | People close to buying | Add to cart, open checkout, return to the same product |
BOF customers convert at much higher rates, so a discount or reminder email has a better chance with them.
The catch is scale: nobody can manually check all the 500,000 customers and see who sits at the bottom this week.
Meet our amazing analyst Jack Ryan
Jack Ryan, an analyst on the analytics team, spoke up. "We already track what people do on the site: views, searches, cart adds, checkout visits. I can use that behavior to predict who is likely to purchase in the next 10 to 15 days, and we target only those people."
Meera gave him 4 weeks to return with a working approach.
Imagine this scenario for 2 customers on a Monday morning.
- Carlos has viewed the same running shoes six times this week, added them to her cart on Saturday and opened checkout on Sunday night.
- Joe visited once, six weeks ago, and looked at a phone case.
If you could email only one, you would pick Carlos. The model makes that call for every customer, every week.
Maths and ROI: Justifying the working of the model
Suppose about 4% of BrightCart's 500,000 customers, roughly 20,000, will buy this month. Assume each contact costs $0.05, and that a model can place 2/3rd (=13,333.33, ~13300) of those buyers in its top 20% of scores. These are indicative numbers for the argument assumption.
| Strategy | Customers contacted | Buyers reached | Cost at $0.05 per contact |
|---|---|---|---|
| Contact everyone | 500,000 | 20,000 | $25,000 |
| Random 20% | 100,000 | about 4,000 | $5,000 |
| Top 20% by model | 100,000 | about 13,300 | $5,000 |
For the same budget as the random 20%, the model reaches more than 3 times the buyers.
Compared with contacting everyone, it cuts cost by 80% while still reaching 2/3rd of buyers. This is the type of argument that a CFO wants to hears and remembers it.
The 2/3rd assumption is modest. In the simulation we build later, the top 10% of customers reach 63.9% of buyers and the top 20% reach 69%. The simulation covers a 10,000 customer sample with a 2.4% purchase rate, so its absolute counts differ from the table above, and the shape of the argument holds.
Meeting between Jack and the Leadership - Action Plan
Jack in his next meeting with leadership answers 5 key questions.
| Question | Answer from the business |
|---|---|
| What happens to the list? | It becomes a weekly email and paid retargeting audience every Monday |
| How far ahead must we see a buyer? | 7 days. Though it can range from 10 to 15 days. |
| Who do we score? | Customers activity on the site in the last 30 days |
| What data can we use? | Web clickstream, telesales, and CRM data etc |
| How do we judge success? | Incremental revenue per dollar, tested against a holdout group |
The answers fix the prediction window, the population and the metrics. Skipping this step and one can risk a model that nobody will use.
Problem Statement
Suppose BrightCart wants to find customers likely to purchase in the next 7 days. Three definitions make that precise:
- Observation window: The historical period (training data) from which we calculate features.
- Prediction window: The future period(Test/Prediction period) in which we look for a purchase.
- Target: Whether the customer purchased during the prediction window.
For example consider a customer C001 and a prediction date of January 31.
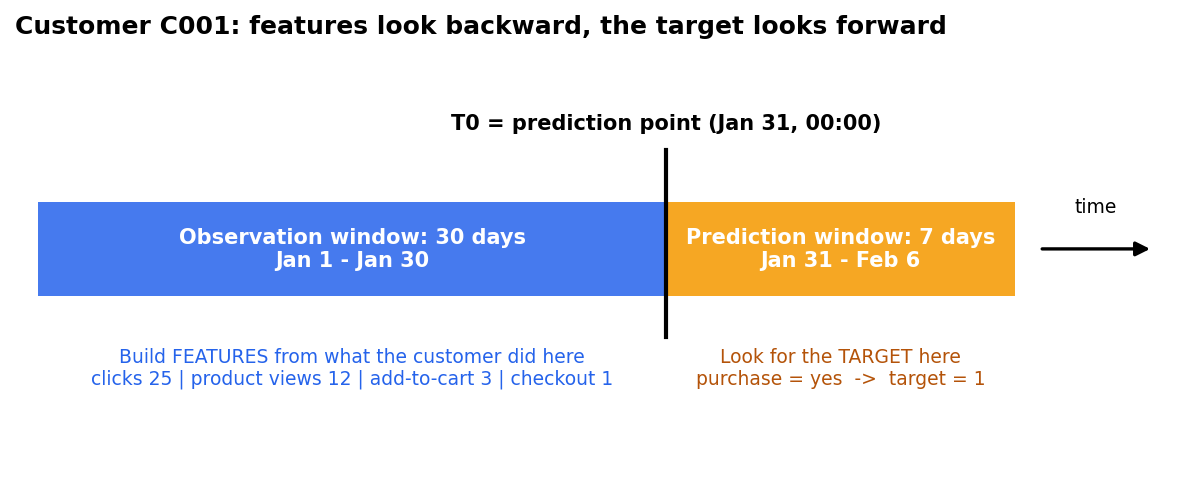
Features look backward from T0. The target looks forward from T0.
How to read the figure:
- The horizontal axis is time. The blue block is the observation window, January 1 to January 30, and everything we know about C001 comes from there.
- The vertical black line is T0, the prediction point, the moment we want to score the customer.
- The orange block is the prediction window, January 31 to February 6. We look there only to learn whether the customer bought.
In the observation window C001 logged
- Clicks - 25
- Product views - 12
- Add-to-Carts - 3,
- Checkout visit - 1
- Payment page visit -1
In the prediction window C001 purchased, so the target is 1. Had C001 not purchased, the target would be 0.
What is a Purchase Propensity Model?
A PPM predicts the probability that a customer will purchase within a defined future period. A well posed question sounds like this: "Given everything we know about a customer up to September 1, what is the probability that the customer will buy between September 2 and September 8?"
If the model returns 0.82 for Customer A, you can read that as an 82% predicted probability (provided the model is reasonably calibrated), which means there is an 82% probability that the customer will purchase. For a full explanation of calibration i.e. what it means for a model's scores to be trustworthy as probabilities, and how to fix it when they aren't, checkout the artcile Calibration: turning a ranking into a probability you can actually trust.
The logical flow of the PPM on one line:
Past Website Behavior -> Customer features ->
ML model -> Purchase Probability -> Marketing Action
A score that never reaches a campaign is only a report, so most of this series is about the steps on either side of the model.
Propensity model and its look-alikes concept
Propensity is often confused with neighboring concepts. They use similar techniques but answer different questions.
| Model | Question it answers | Typical action |
|---|---|---|
| Purchase propensity | Will this customer buy in the next N days? | Prioritize campaign audiences |
| Response model | Will this customer respond to this specific offer? | Optimize offer targeting |
| Churn model | Will this customer stop buying? | Retention campaigns |
| Customer lifetime value (CLV) | How much value will this customer bring overall? | Budget allocation, VIP programs |
| Uplift model | Will this customer buy because of our intervention? | Avoid wasting spend on "sure things" |
The CFO's request for incremental revenue points at the last row. Propensity finds likely buyers, and uplift finds the buyers your campaign actually created. Part 6 - Beyond Propensity Scores compares the two on simulated data.
Let's unpack the above bold statement - "The CFO's request for incremental revenue points at the last row"
Earlier above in that same article we find that the CFO says: "Show me incremental revenue per dollar, not open rates." The word "incremental" is the key. The CFO isn't asking "how many people bought after we ran the campaign." She is asking "how many people bought because we ran the campaign, that wouldn't have bought otherwise." This ideally means it is a request for uplift, the last row in the above comparison table.
"Propensity finds likely buyers, and uplift finds the buyers your campaign actually created"
This is the core distinction between the two. It is easiest to see this with an example. Let's suppose we have two customers:
- Dolly buys running shoes every month like clockwork, campaign or no campaign. A propensity model scores her very high, because she is, in fact, likely to buy.
- Ronny is on the fence. He will buy this week only if he gets a reminder email. A propensity model might score him lower than Dolly, because on his own, he's less likely to buy.
If we only have a propensity model, we would email Dolly first. But emailing Dolly wastes the contact. She was buying anyway; the email created zero incremental sales for her. Ronny is the one whose purchase the campaign actually causes.
A propensity model answers "who's likely to buy?" An uplift model answers "whose behavior does contacting them actually change?" Those are different questions, and a customer can score high on one and low on the other.
What is the prediction unit?
Before building anything, we need decide what one row of the dataset represents:
- Customer: Will this customer buy anything in the next 7 days?
- Customer and product: Which product is this customer likely to buy?
- Customer and category: Will this customer buy shoes this week?
- Session: Will this visit end in a purchase?
A general propensity model usually works at the customer level, and so we will work at customer level. If the question was "which product goes in the email?", a customer and product grain would fit better.
Key takeaways
- Blanket campaigns spend on people who are far from buying or would buy anyway. A propensity model ranks customers by their chance of purchase in a defined window.
- The money (ROI) case is simple: the same budget reaches several times more buyers, or a fraction of the budget reaches most of them.
- Start from the business use case: what action follows the score, how far ahead we need to see, who gets scored, and how success is measured.
- A well-posed problem has an observation window for features, a prediction window for the target, and a clear prediction unit.
Part 2 - Model Designing: Observation Window , Populations and Data Leakage makes the design decisions that separate a theoritical model from a production one: how to choose the two windows, who belongs in the model, and how to avoid leakage.